
Are you curious about how LEDs work in indoor gardening? If so, you’re not alone! Here are some things you may not know about LED grow lights.
Light Intensity for Growth
(How to express, measure, and calculate it)
Light intensity is referred to the rate of energy delivered by the light source to a certain area of the surface. It is a key characteristic of a light source and is used to measure the performance of a light source.
There are several measures to indicate the light intensity from different perspectives, including radiant intensity, luminous intensity, irradiance, and radiance. Among them, luminous flux, illuminance, and PAR are commonly used in artificial light for plant growth.
Luminous Flux
Luminous flux is the measure of the perceived power of light, which is to reflect the varying sensitivity of the human eye to different wavelengths of light.
The SI unit of luminous flux is the lumen (lm). One lumen is defined as the luminous flux of light generated by a light source that emits one candela of luminous intensity over a solid angle of one steradian.
The luminous flux accounts for the sensitivity of the eye by weighting the power at each wavelength with the luminosity function, which represents the eye’s response to different wavelengths. Thus, the luminous flux is a weighted sum of the power only at all visible wavelength bands.
The light outside the visible band, such as UV and infrared, does not contribute. The ratio of the luminous flux to the total radiant flux is called the luminous efficacy.
Luminous flux is commonly used as an objective measure of the useful light emitted by a light source.
To measure the luminous flux of a light source, an integrating sphere needs to be used.
Illuminance
The SI units of illuminance are lux (lx) or lumens per square meter(lm/m²). Illuminance is usually used to indicate the brightness of a light source that the human eye feels. Illuminance can be measured by a portable lux meter.
Photosynthetically Active Radiation (PAR)
PAR is photosynthetically active radiation, indicating the spectral range from 400 to 700nm which photosynthetic organisms are able to use in the process of photosynthesis. Photons at shorter wavelengths contain too much energy which may damage the cells and tissues of most plants. Photons at higher wavelengths can not carry enough energy to make the photosynthesis process.
A light source is usually measured in the integrating sphere to get PAR. The calculation formula of PAR is as follows:

From the calculation, it is obvious that PAR is related to the wavelength of the light source emitted. In the photosynthetic process, Chlorophyll, the most abundant plant pigment, is most efficient in capturing red and blue light. Accessory pigments such as carotenes and xanthophylls capture some green light and pass it on to the photosynthetic process, but enough of the green wavelengths are reflected to show the green of their leaves. Different plants or plants in different growth stages need different spectra to support their growth at the most efficient level.
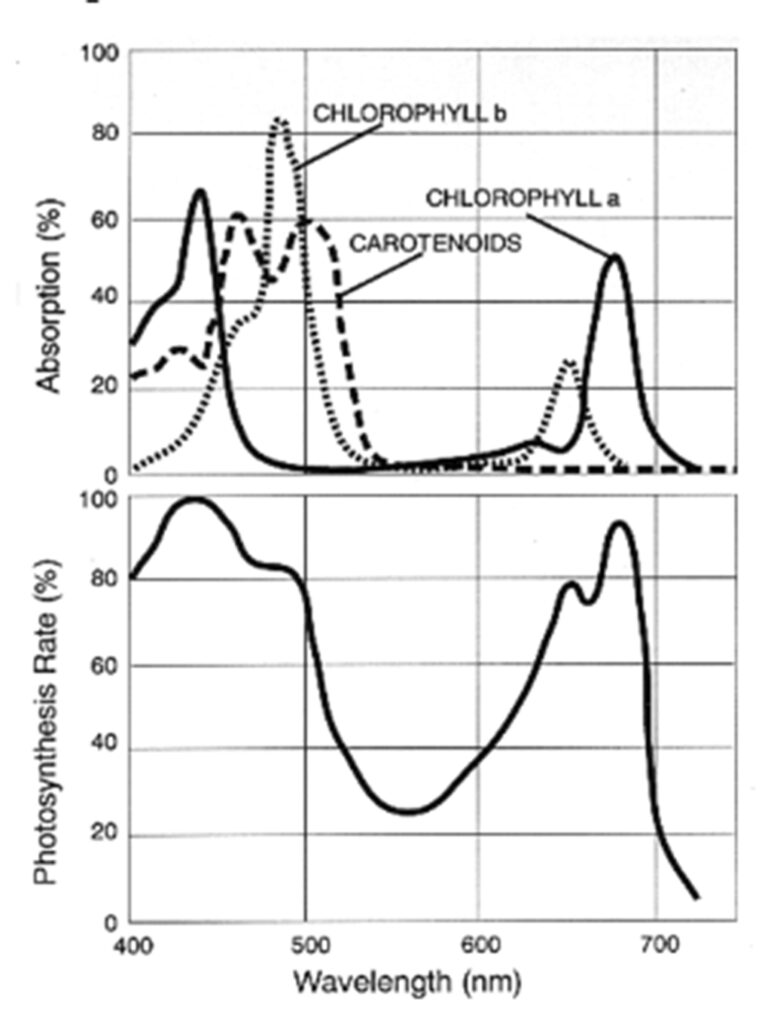
Absorption spectra for chlorophyII-a, chlorophyII-b, and carotenoids in a solution (Top) PAR action spectrum of an isolated chloroplast
Photosynthetic Photon Flux (PPF) and Photosynthetic Photon Flux Density (PPFD)
To describe PAR more accurately, photosynthetic photon flux (PPF) and yield photon flux (YPF) are used. PPF is the number of photons emitted from a light source at a wavelength from 400 to 700nm in a second. PPF values all photons equally in this wavelength range. The unit of PPF is umol/s. The calculation of PPF is as follows.
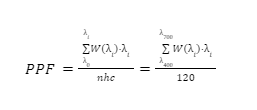
PPF: Photosynthetic photon flux, umol/s
W(λ): Spectral power density, W/nm;
n: 1mol number of photons, 6.02*1017 ;
h: Planck constant, 6.626*10-34 J·s;
c: Light velocity, 3.0*108 m/s;
λ: Wavelength, nm.
PPF can be measured and calculated by integrating a sphere and spectrometer. Use a spectrometer to analyze the spectrum and power distribution of different wavelengths (SPD), while specific data required to calculate the PPF through the formulas above is supplied, including the spectral power density (W(λ)) at each wavelength by 1nm. In the range of 400nm to 700nm, integrating the spectral power density at each wavelength multiplied by the wavelength value results in the value of PPF. The color ratio of the light source can also be calculated through this method by integrating the spectral power density at each wavelength multiplied by wavelength value at separated wavelength ranges.
In reference to the grow light spectrum, we usually use the SQD spectrum which is the PPF distribution of different wavelengths from 400nm-700nm. The SQD spectrum can be converted from the SPD spectrum using the calculation above.
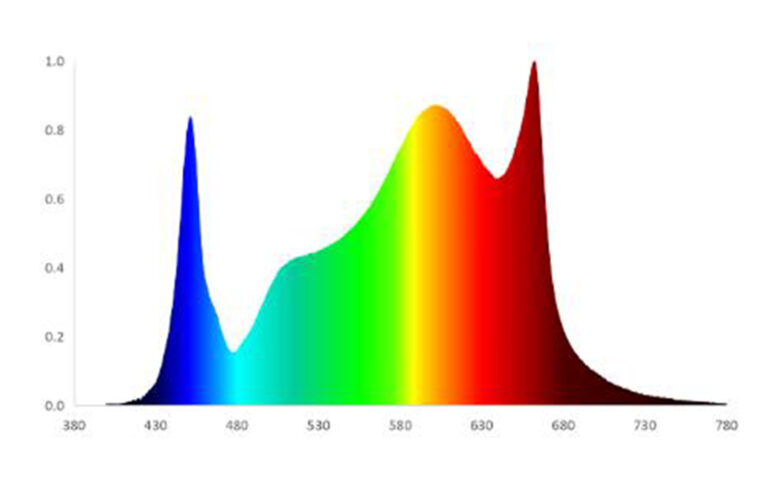
The relative spectrum of power distribution (SPD) of Flexstar MATRIX 860W
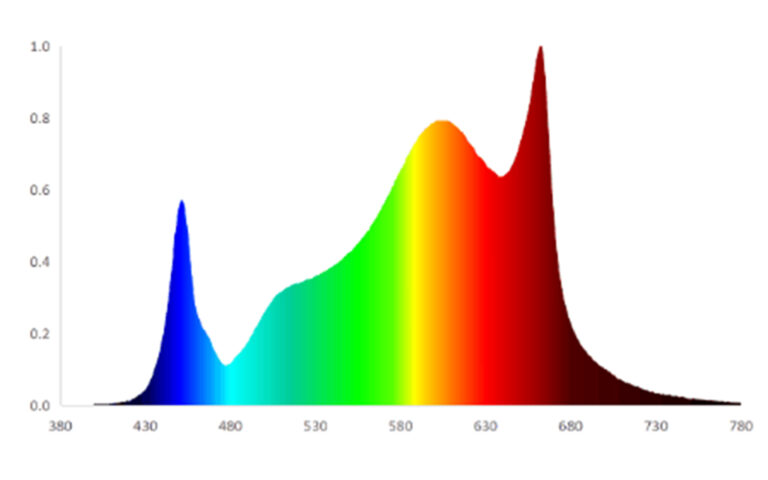
Relative spectrum of PPF distribution (SQD) of Flexstar MATRIX 860W
Photosynthetic photon flux density (PPFD) is the number of photons emitted from a light source on a certain projected area in a second at the wavelength from 400 to 700nm. The unit of PPFD is umol/m²/s. This projected area is related to the distance between the light source and the measurement point. Thus, measurement distance is required to be indicated with PPFD value. PPFD of a measurement point can be measured by a PPFD light meter without an integrating sphere.
Yield Photon Flux (YPF)
Unlike PPF which values photons at different wavelengths equally, the yield photon flux (YPF) weights photons in the range from 360nm to 760nm and is based on the plant’s photosynthetic response. If the exact spectrum of the light is known, the photosynthetic photon flux density (PPFD) can be modified by applying different weighting factors to different wavelengths, which results in a quantity of YPF.
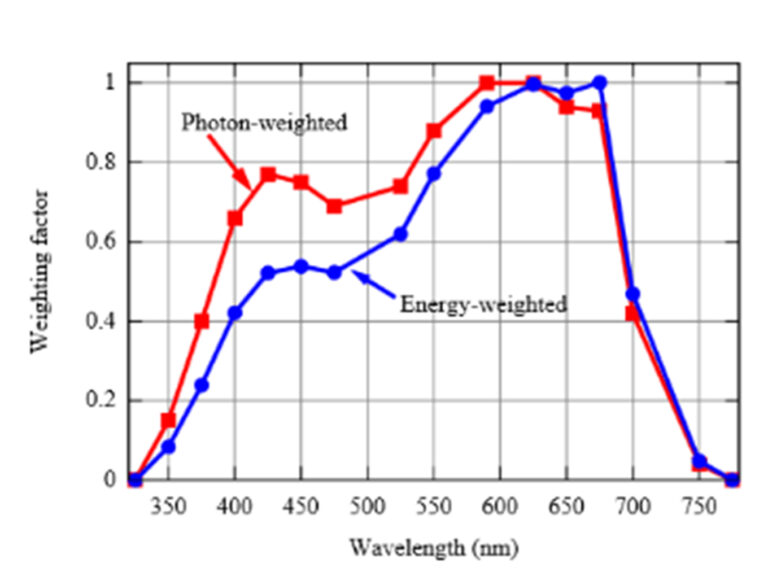
The weighting factor for photosynthesis is based on short-term measurements on single leaves
The YPF weighting factor curve above shows different weighting factors at each wavelength on the photon-weighted basis (red curve) and energy-weighted basis (blue curve). On the photo-weighted curve, the photons around 610nm have the highest amount of photosynthesis per photon. Although, the maximum amount of photosynthesis per incident unit of energy is at a longer wavelength around 650nm because of more energy carried per photon by short-wavelength photons.
Light Uniformity
Light uniformity shows the uniformity of light distribution in the illuminated area. A higher level of light uniformity creates more equal illumination in the area, which helps to create a uniform crop, especially in large-scale cultivation. The light uniformity is defined as follows:

The light uniformity value is between 0 and 1. Closer to 1 means higher light uniformity on the measured area. Usually, the light intensity (E) measured above is illuminance or PPFD. To measure the light uniformity of a certain area, this area is equally divided into small square grids.
The PPFD or illuminance is measured at the central point of each square grid, then choose the minimum value and calculate the average value of them. The smaller a grid is divided on the measured area, the more accurate light uniformity can be achieved.
When all the data are collected, a distribution map of light intensity, which shows the light distribution in a visualized way, can be generated. Pictures below show the several steps of light uniformity measurement of a LED light source (AEpic high-power LED from AEssense).
For the same light source and measured area, the height of the light source (distance between the light source and measured point) is the main variable that affects the light uniformity and distribution map.
To achieve high light uniformity, there are several methods. Firstly, improve the light fixture by adding a reflector. This is useful for a fixed single-bulb light source like an HPS light. With a reflector, an HPS can distribute more light to the further area from the light than an HPS light without a reflector.
Secondly, use a bar LED light. With the advantage of size and low power required, LED light can be made into a multi-split system, which has one main controller and driver with several light bars.
For example, the Flexstar PRO and MATRIX series LED lights use one controlling box and 6-10 LED bars which can easily cover an area from 4’x4’ to 4’x6’ with a high light uniformity. Another advantage of this type of LED is that the coverage area and uniformity can be adjusted easily by changing the distance between the light bars and the number of bars.
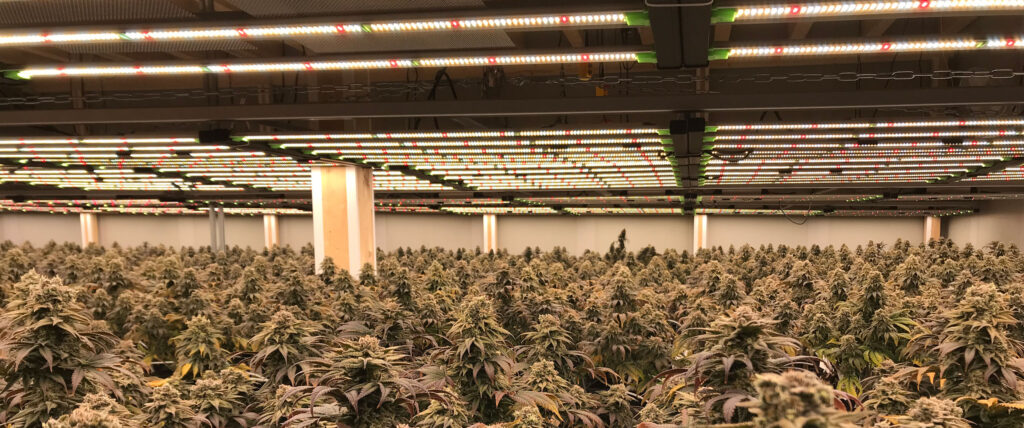
Adding more lights in the same area is another option to improve light uniformity. Usually, this method is simple, increasing the coverage area and creating a higher light uniformity, while the average light intensity is also improved.
However, more initial investment and higher electricity consumption make this option less popular in the use of cultivation. Besides, more heat created potentially increases the cost of temperature control especially for indoor cultivation.
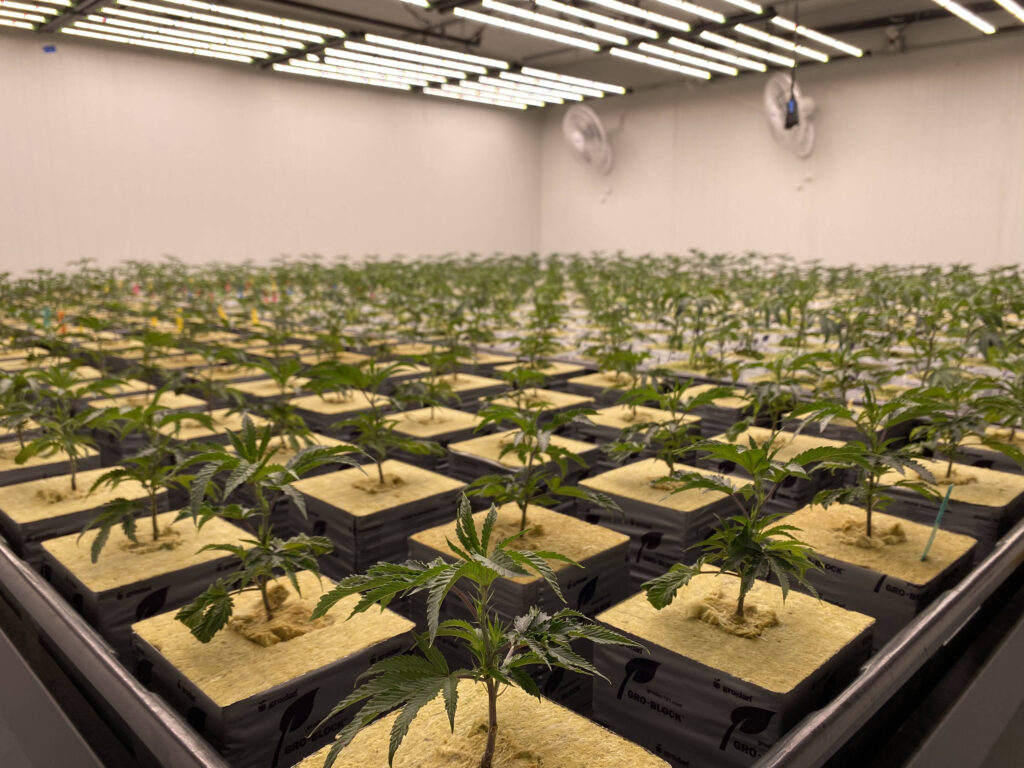
Light uniformity is also related to the quantity, height, and distribution of light sources in a cultivation area. The position and distribution of plants are important too. For indoor cultivation, it is suggested that plants are set in the central area of a room instead of keeping them on walls with a path in between. Thus, growers who require a high uniformity of light need to consider it as a part of the design of the cultivation area.
Reference:
Luminous flux, Wikipedia, https://en.wikipedia.org/wiki/Luminous_flux, accessed on 2017.8.7
Illuminance, Wikipedia, https://en.wikipedia.org/wiki/Illuminance, accessed on 2017.8.7
PAR, Wikipedia, https://en.wikipedia.org/wiki/Photosynthetically_active_radiation, accessed on 2017.8.9
Sun, Jindong; Nishio, John N.; Vogelmann, Thomas C. (1998). “Green Light Drives CO2 Fixation Deep within Leaves”. Plant Cell Physiol. 39(10): 1020-1026
Barnes, C.; Tibbitts, T.; Sager, J.; Deitzer, G.; Bubenheim, D.; Koerner, G.; Bugbee, B. (1993). “Accuracy of quantum sensors measuring yield photon flux and photosynthetic photon flux”. HortScience: A Publication of the American Society for Horticultural Science. 28 (12): 1197–1200. ISSN 0018-5345.
